
Dashboards
This article takes you through the Cloud Navigator dashboards, as well as how to export information for use externally.
Contents
Application Portfolio Management
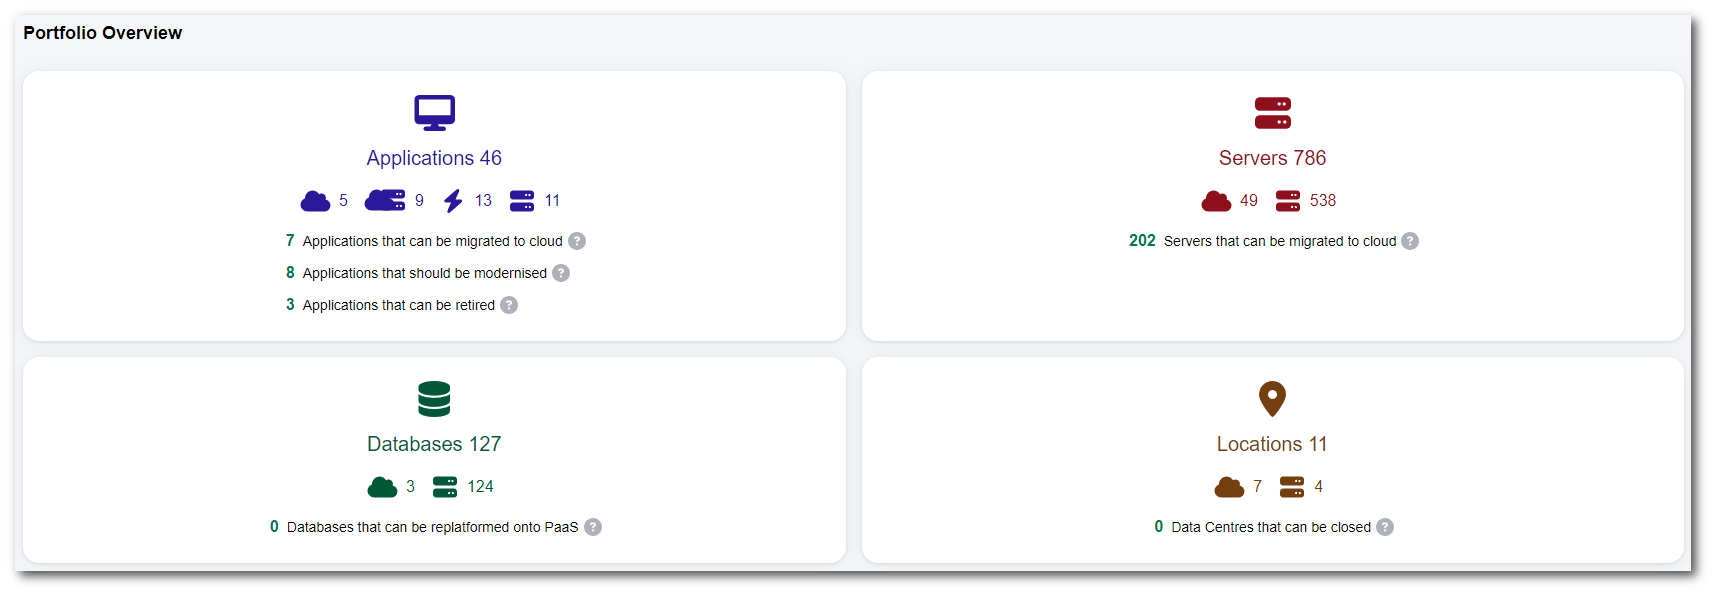
Portfolio Overview
THIS WILL BE UPDATED LARER
This 'Portfolio Overview' dashboard gives you a breakdown of the overall status of your Cloud Navigator instance. This shows the estate (Numbers of servers, applications etc). How many Applications can be migrated to Cloud, Servers that can be migrated to cloud and Databases that can be replatformed onto PaaS and more.
Insights (Tab) - Portfolio Overview (Sidebar)
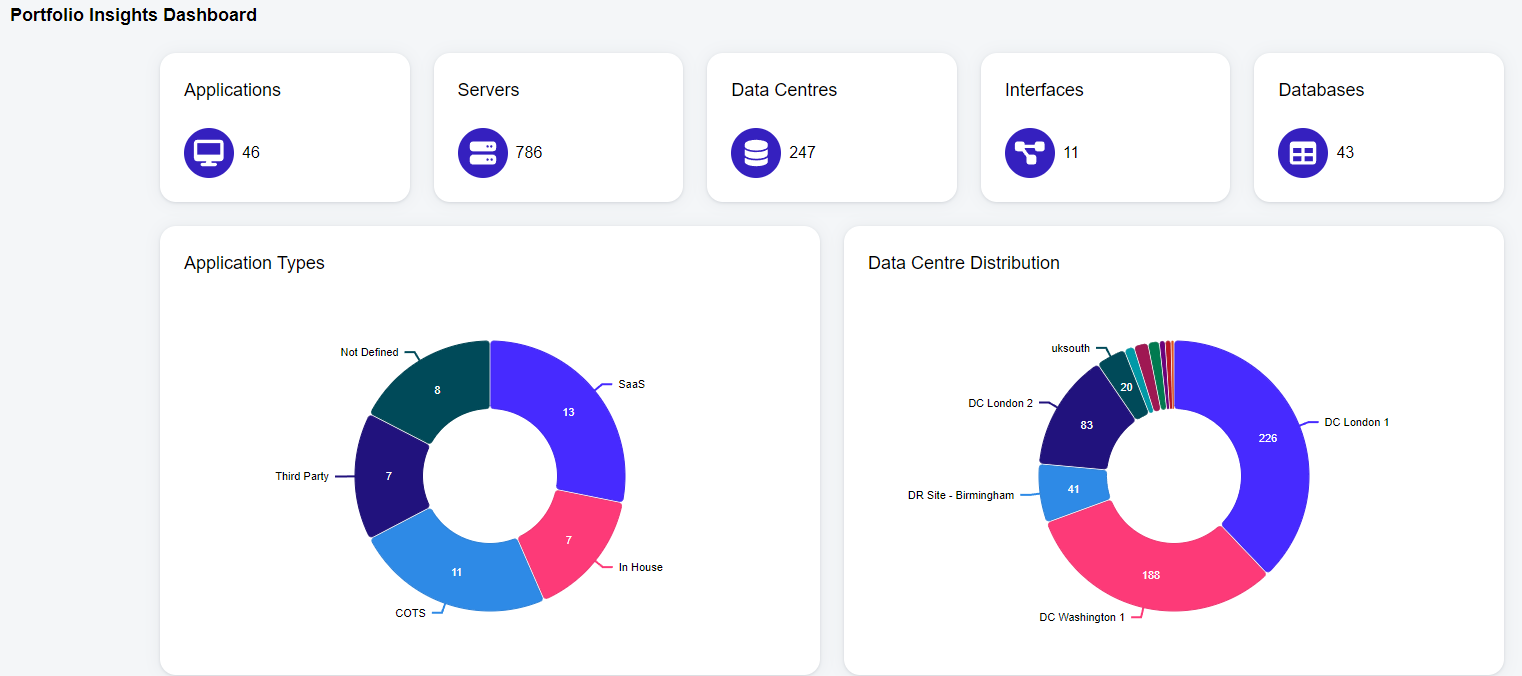
Portfolio insights dashboard
This dashboard features pre-built visualisations via pie and bar charts on several data points from within your account. Some notable visualisations are Application Types, Operating System Distribution, Application Scoring Status and Ease Of Migration. All of these visualisations can be exported as PNG, using the 'Export to PNG' button in the bottom right of each report.
Insights (Tab) - Portfolio Insights Dashboard (Sidebar)
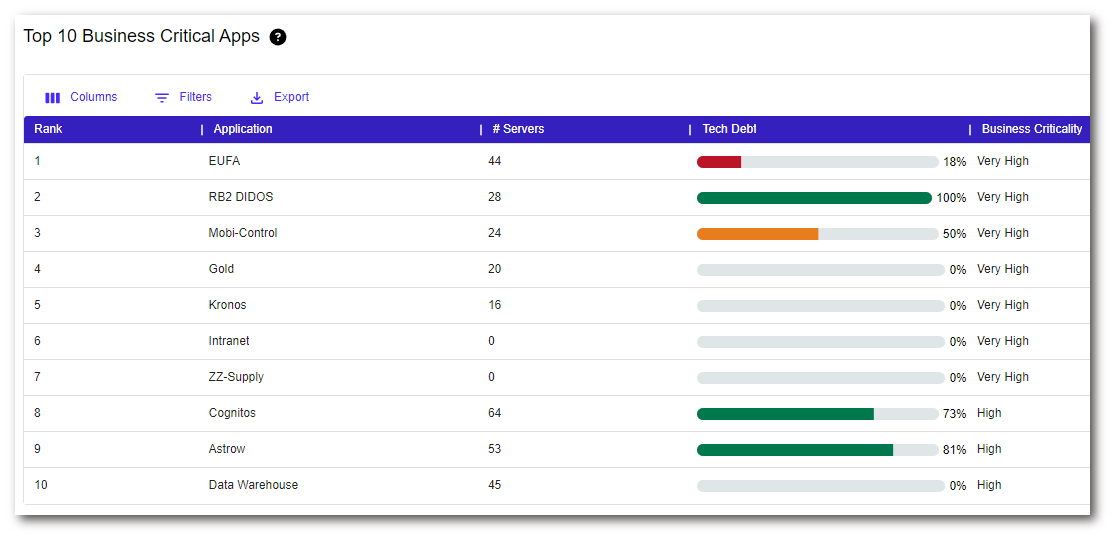
Top 10 business critical apps
This dashboard provides a view of the most important applications in the portfolio based on application footprint (number of servers) and business criticality. All of these visualisations can be exported as PNG, using the 'Export to PNG' button in the bottom right of each report.
Insights (Tab) - Top 10 Business Critical Apps (Sidebar)
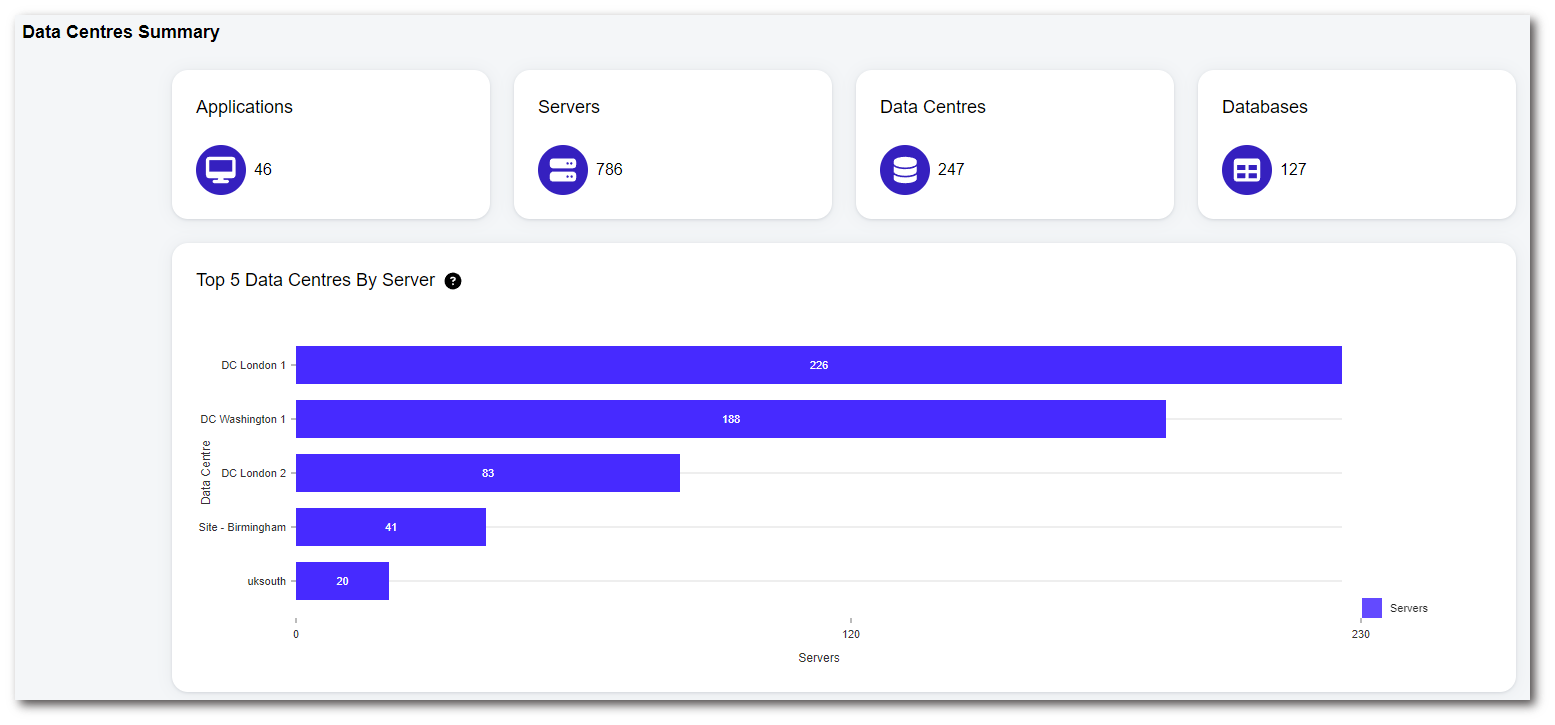
Data centres summary
This dashboard provides a data centre-centric view of the portfolio enabling you to see which are the largest or most important data centres and the level of tech debt within them. The charts can be exported as PNG, using the 'Export to PNG' button in the bottom right of each chart.
Insights (Tab) - Data Centres Summary (Sidebar)
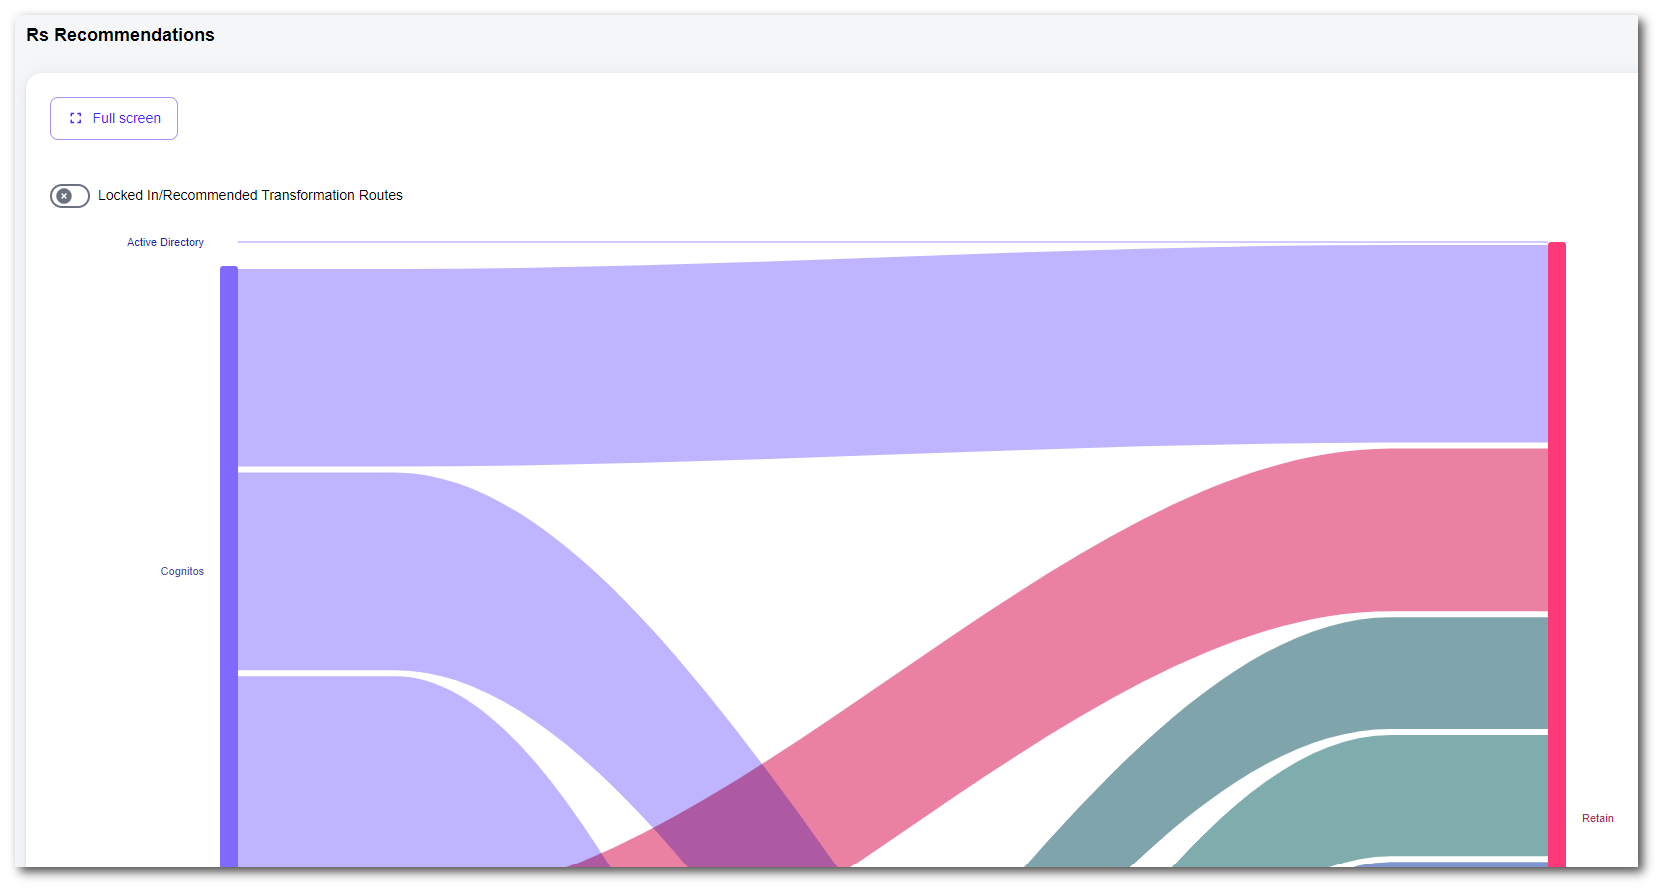
R’s recommendations
This dashboard shows you all of your applications and their associated breakdowns with each of the routes you can take to cloud. The charts here are fully interactable and exportable out of the platform as PNGs.
Insights (Tab) - Rs Recommendations (Sidebar)
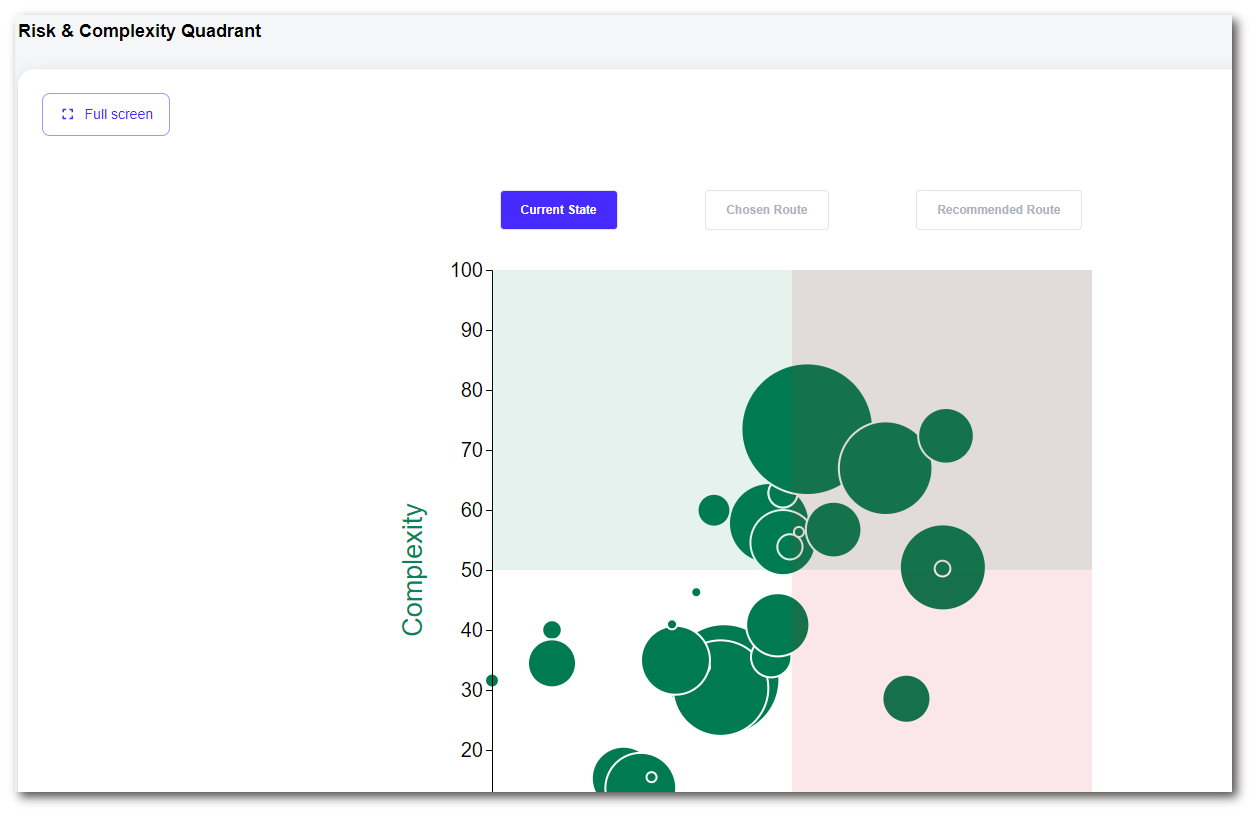
Risk & complexity quadrant
This dashboard allows you to use a scatter graph to understand the current state of your applications, a breakdown based on chosen route associated timescales as well as applications recommended routes. The charts here are fully interactable and exportable out of the platform as PNGs.
Insights (Tab) - Risk & Complexity Quadrant (Sidebar)
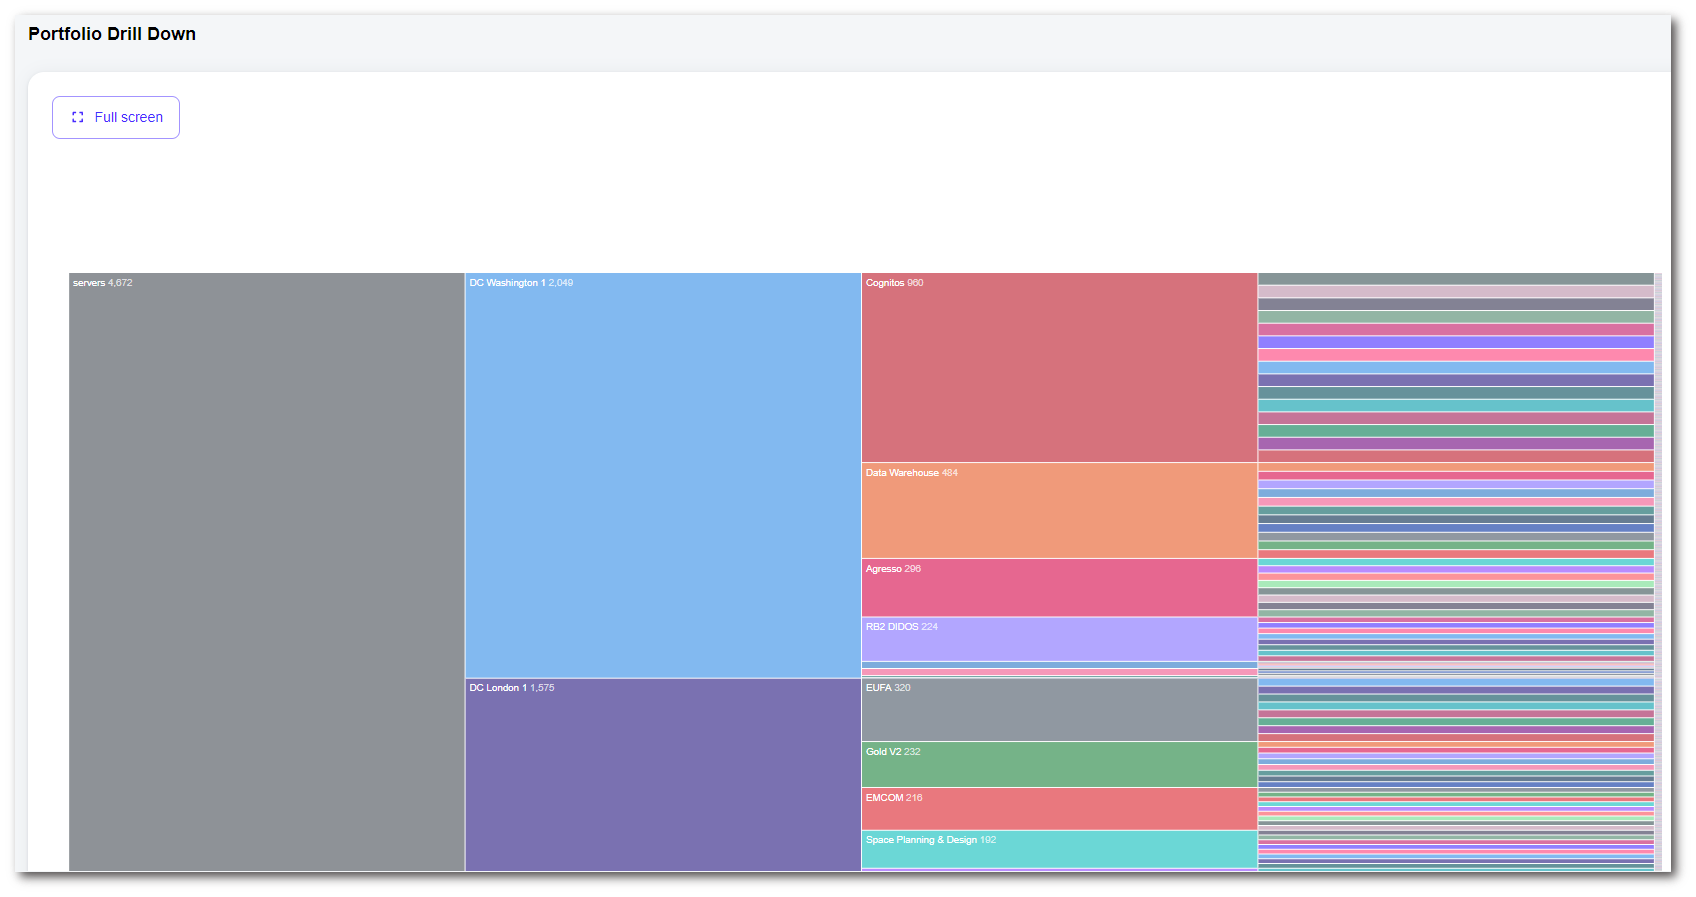
Portfolio drill down
This dashboard breaks down all the assets in the platform. This starts at a high level of Servers and then Data Centre's, then further into Applications and finally the individual servers. The charts here are completely interactable and exportable out of the platform as PNGs.
This dashboard requires Servers, Data Centres and Applications to be uploaded for populate.
Insights (Tab) - Portfolio Drill Down (Sidebar)
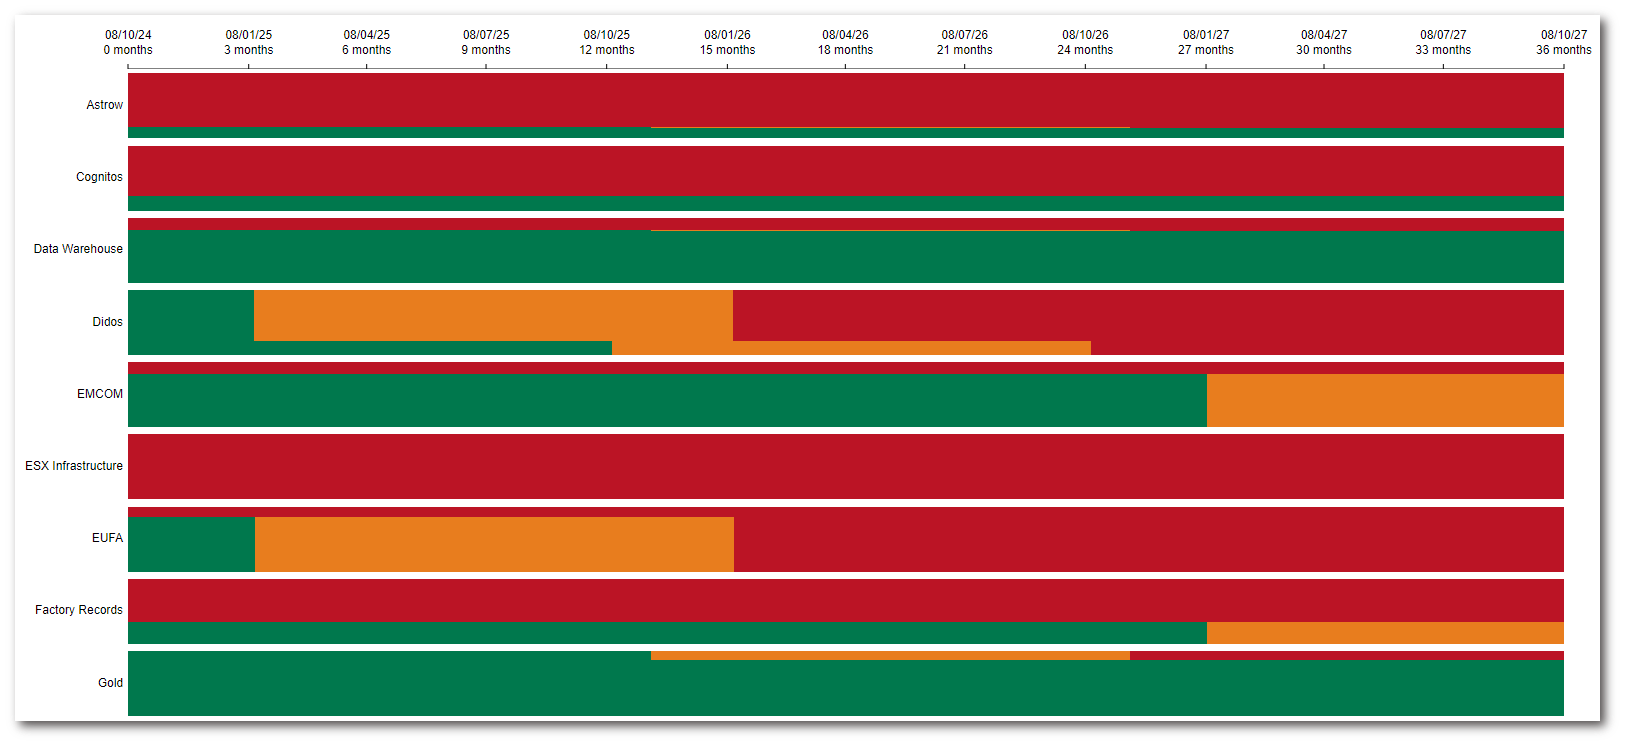
Technical debt timeline
This dashboard show you all the technical debt timelines for all of the applications featured in the platform. The charts here are fully interactable and exportable out of the platform as PNGs.
Insights (Tab) - Technical Debt Timeline (Sidebar)
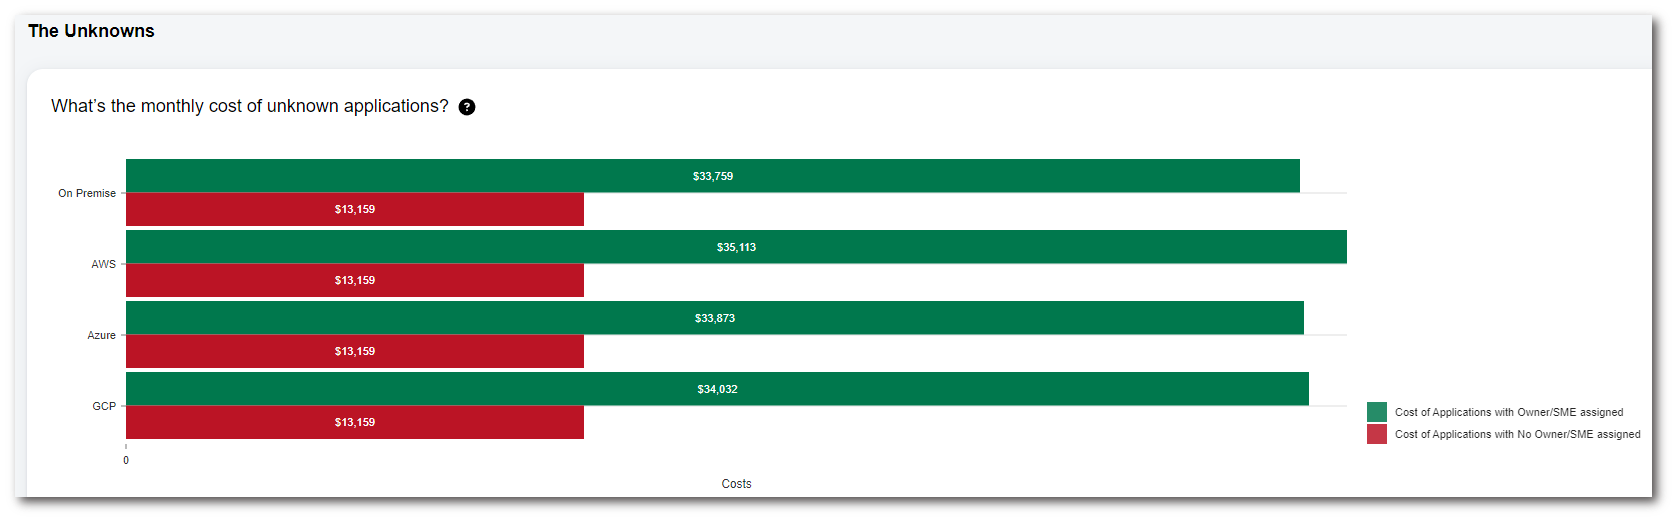
The unknowns
This dashboard illustrates the monthly costs for servers that have a designated owner, as well as those that do not. It is recommended to conduct a thorough evaluation to identify any servers without an assigned owner that may no longer be necessary for future operations. By optimising your server usage, you can effectively manage costs and allocate resources more efficiently.
Insights (Tab) - The Unknowns (Sidebar)
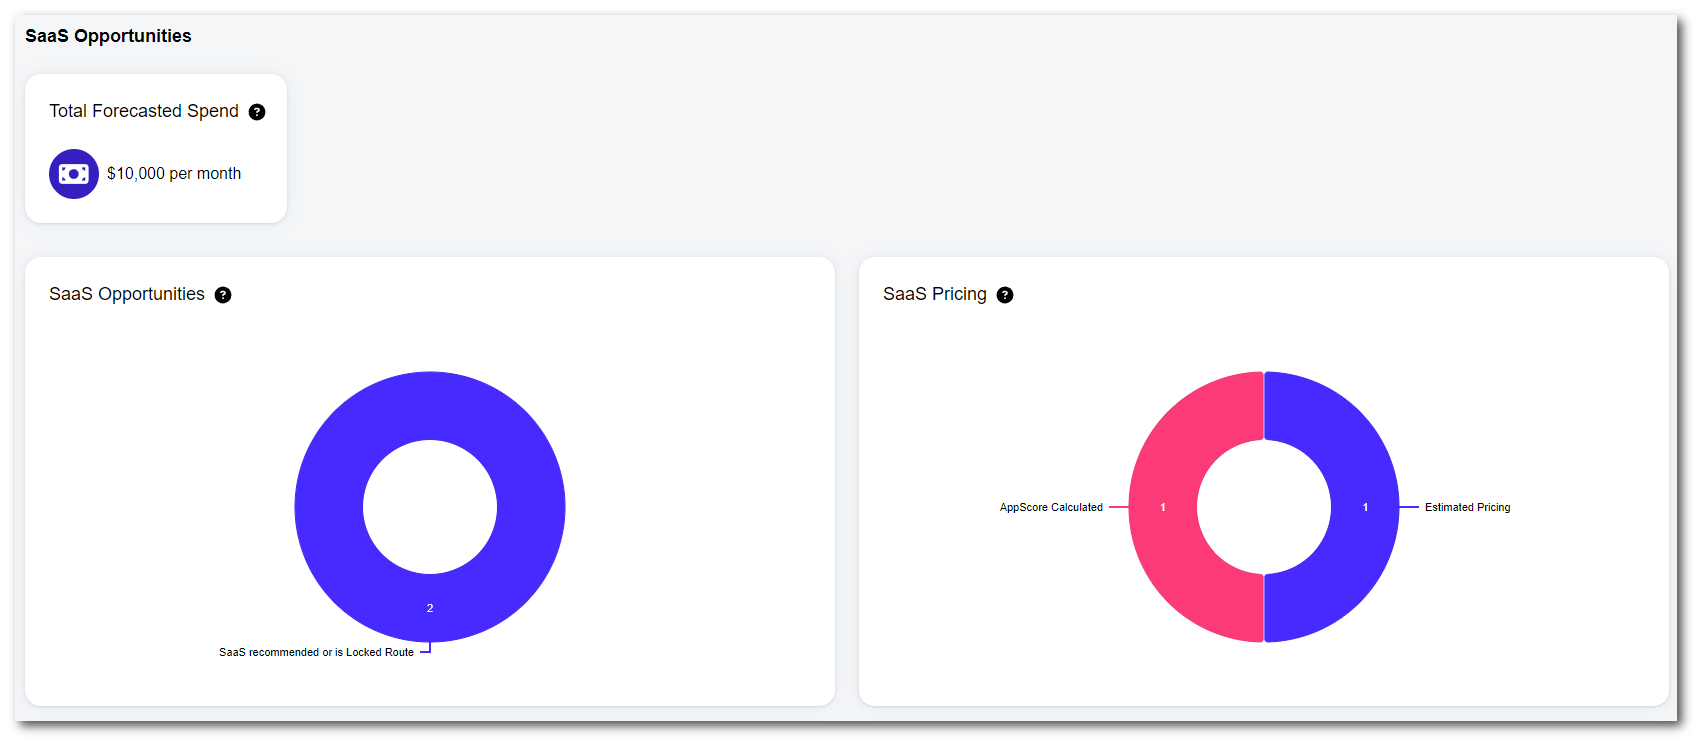
SaaS opportunities
This dashboards a forecasted spend spend per month for Repurchase FPC for all applications with a route of Repurchase. Other reports contained within here are the number of opportunities to use SaaS as well as a breakdown of purchase methods.
Insights (Tab) - SaaS Opportunities (Sidebar)
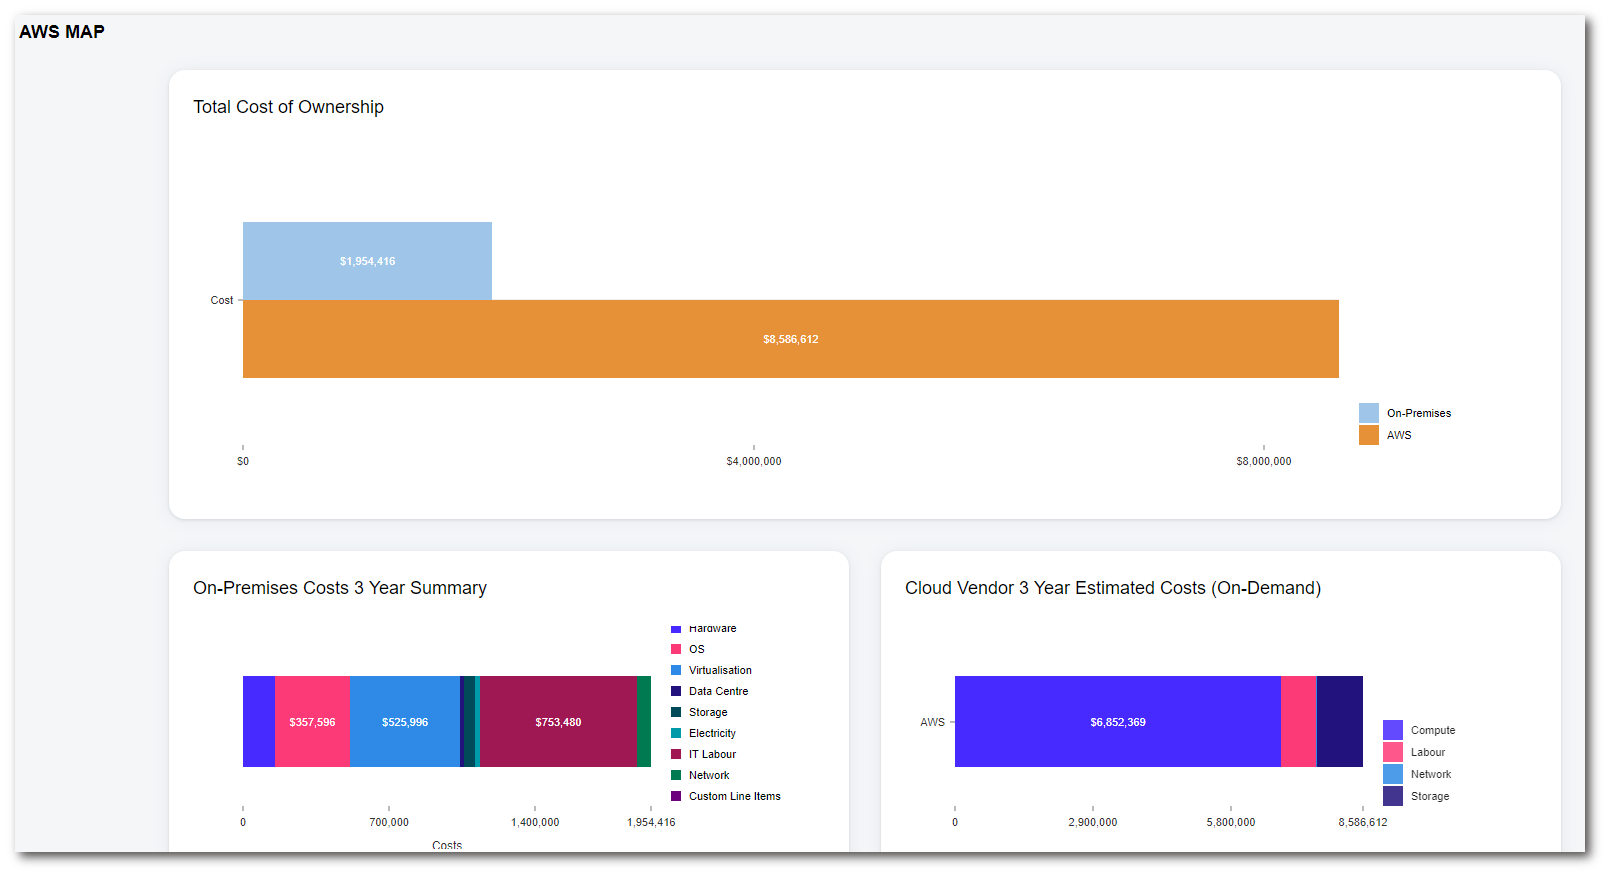
AWS MAP
This dashboard is specialised for our AWS MAP team, focusing on reports that are essential for the AWS MAP Assessment.
Insights (Tab) - AWS MAP (Sidebar)
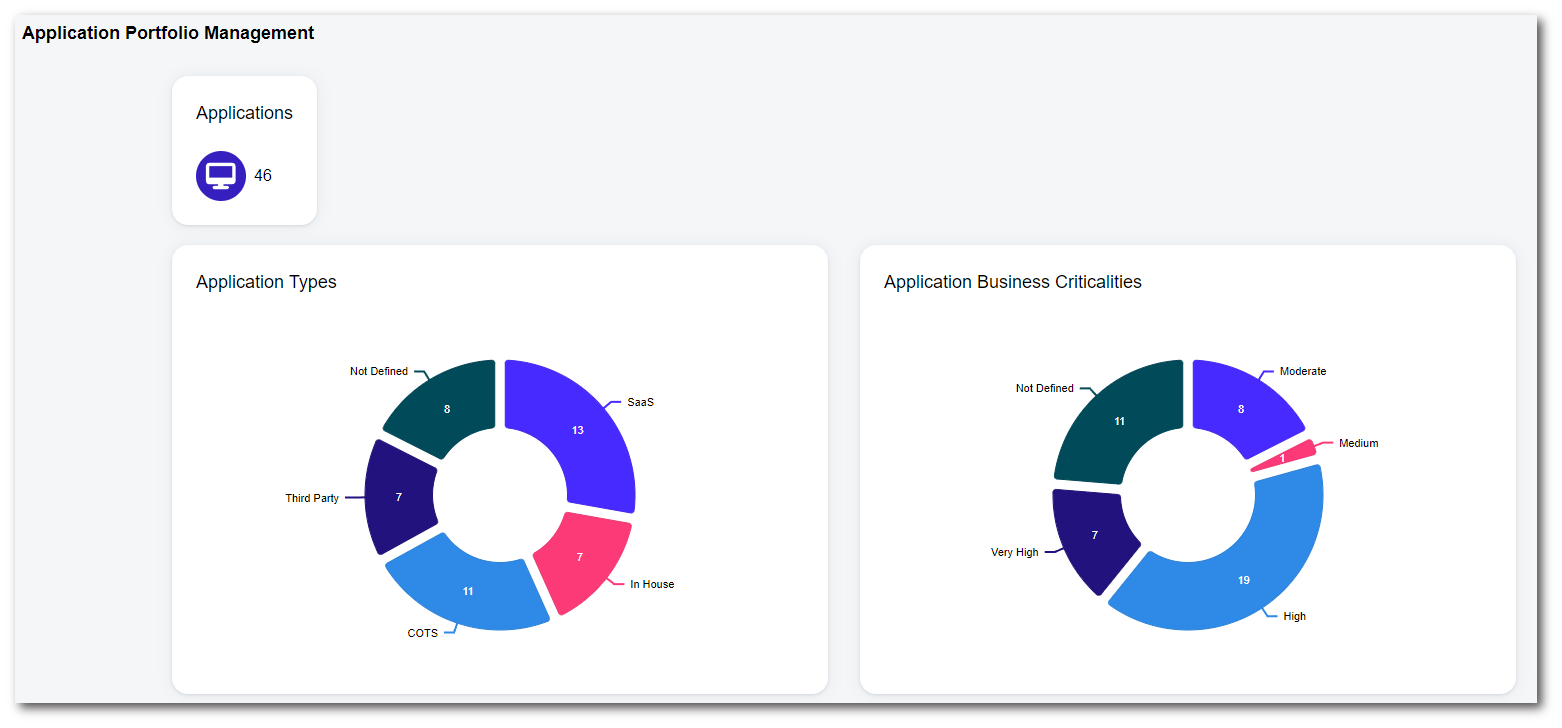
Application Portfolio Management
This dashboard is specialised for our Application Portfolio Management team, focusing on reports that are essential for the Application Portfolio Assessment.
Insights (Tab) - Application Portfolio Management (Sidebar)
To contact Cloud Navigator sales or support for any reason at all, simply email cloudnavigator-support.gb@softwareone.com and one of the team will get back to you. If your issue is urgent, please mark the email as URGENT in the subject line.